All the results were rerun through the database following further validation checks on the new Global Screening Array chip and improvements to the algorithms. Living DNA have also introduced a feature called family DNA views. We now have the option to see our family ancestry maps at three different confidence ranges: cautious, standard and complete. Here are the descriptions from Living DNA:
- Cautious: Here we have grouped genetically similar populations together. We are most certain about these assignments of your ancestry breakdown.
- Standard: Here we highlight the sources of your ancestry which are likely to be present, using our best guess of the exact source. Ancestry that cannot be attributed to one of our reference populations is shown as being 'unassigned'.
- Complete: Here we have attempted to assign all ancestry allocating 'unassigned' percentages to regions to which they look most similar. There will be more uncertainty associated with these assignments.
The family ancestry maps show your ancestral breakdown at three different levels: global, regional and subregional. The maps are intended to show "the areas of the world where you share genetic ancestry in recent times (10 generations)".
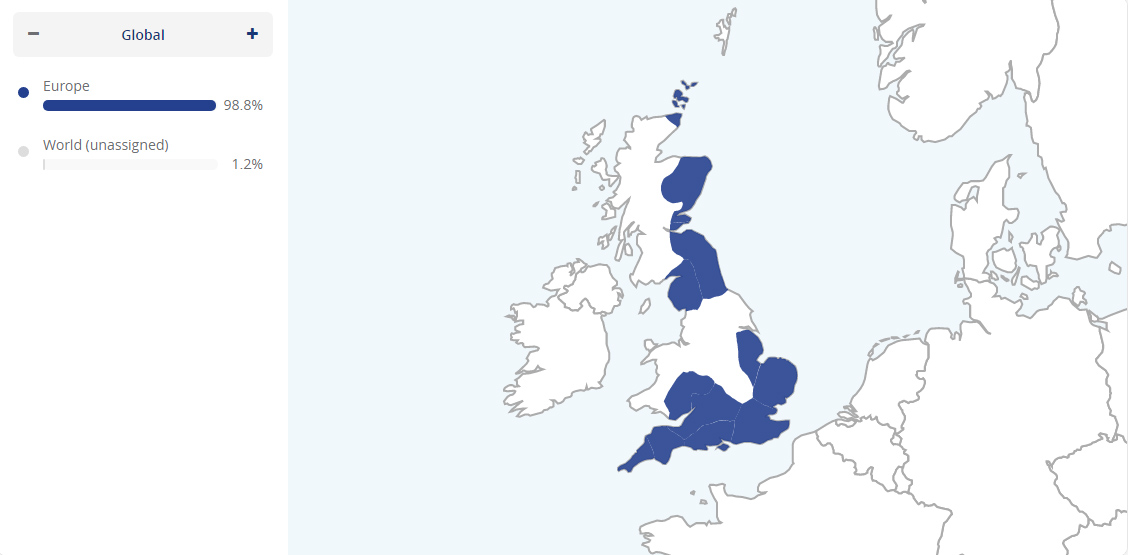
Cautious
Here are my new results in the cautious view at the global, regional and subregional levels.


Standard
Here are my new results in the standard view at the global, regional and subregional levels.


Here are my new results in the complete view at the global, regional and subregional levels.


My genealogical ancestry
For comparison here is a chart showing the place of birth of all my ancestors going back for five generations. (The chart is inspired by the #Mycolorfulancestry meme started by J. Paul Hawthorne over at the Geneaspy blog.)

Discussion
The biggest change in my results is that the Lincolnshire component has dropped from 17.5% to just 4.1%. I was somewhat perplexed by the high Lincolnshire percentage before so this lower assignment seems more in line with what I might have expected. Devon has dropped from 16.2% to 7.3% but Cornwall has now gone up from 4.6% to 8.2%. I've also lost the small trace percentage from North Yorkshire. You can see my family ancestry maps from the first version of the Living DNA test here.
The results still broadly correlate with my known genealogical ancestry, though more of my ancestry has been assigned to the north of England and Scotland than I would have expected. I don't have any known ancestry from Cornwall or South Wales but I suspect there's a lot of overlap for neighbouring counties, and this could represent my Somerset and Bristol ancestry. And of course I still have a number of lines that I've not been able to trace back any further for various reasons.
Living DNA have further updates planned for later this year so it will be interesting to see how my results evolve over time.
2 comments:
Debbie - Do you have any idea what Living DNA's analysis is apt to do with someone like me who has countless ancestors from Colonial America, most of whom presumably came from England or Scotland, and almost no one who arrived from England or Scotland more recently than 1850 or so? Will they be able to sort out those old chromosome segments or will it become an amorphous blob of "UK" DNA? :)
Thanks!
Dwight Holmes
Dwight
There are some reviews from people with Colonial American ancestry listed here:
https://isogg.org/wiki/Living_DNA
The test focuses on ancestry within the last ten generations. There is no reference database of people with recent Colonial ancestry so you get matched with the next closest populations. I think most of the results I've seen for Americans come out with small percentages spread out across the different counties. German is not currently showing up but shows up as something like East Anglian.
Post a Comment